Overview of the Funding Landscape in 2026
Graduate student compensation is undergoing one of its fastest periods of revision in decades. Unionization campaigns, inflation pressure, and institutional competition for doctoral talent have pushed universities to raise stipend floors across multiple cycles. Even so, the baseline problem has not disappeared.
The central finding of this benchmark report is that nominal stipend growth has outpaced neither tuition complexity nor local living costs. A headline figure can look competitive and still leave a student below a basic living-wage threshold once city-specific costs, mandatory fees, summer funding gaps, and waiver phase-outs are accounted for.
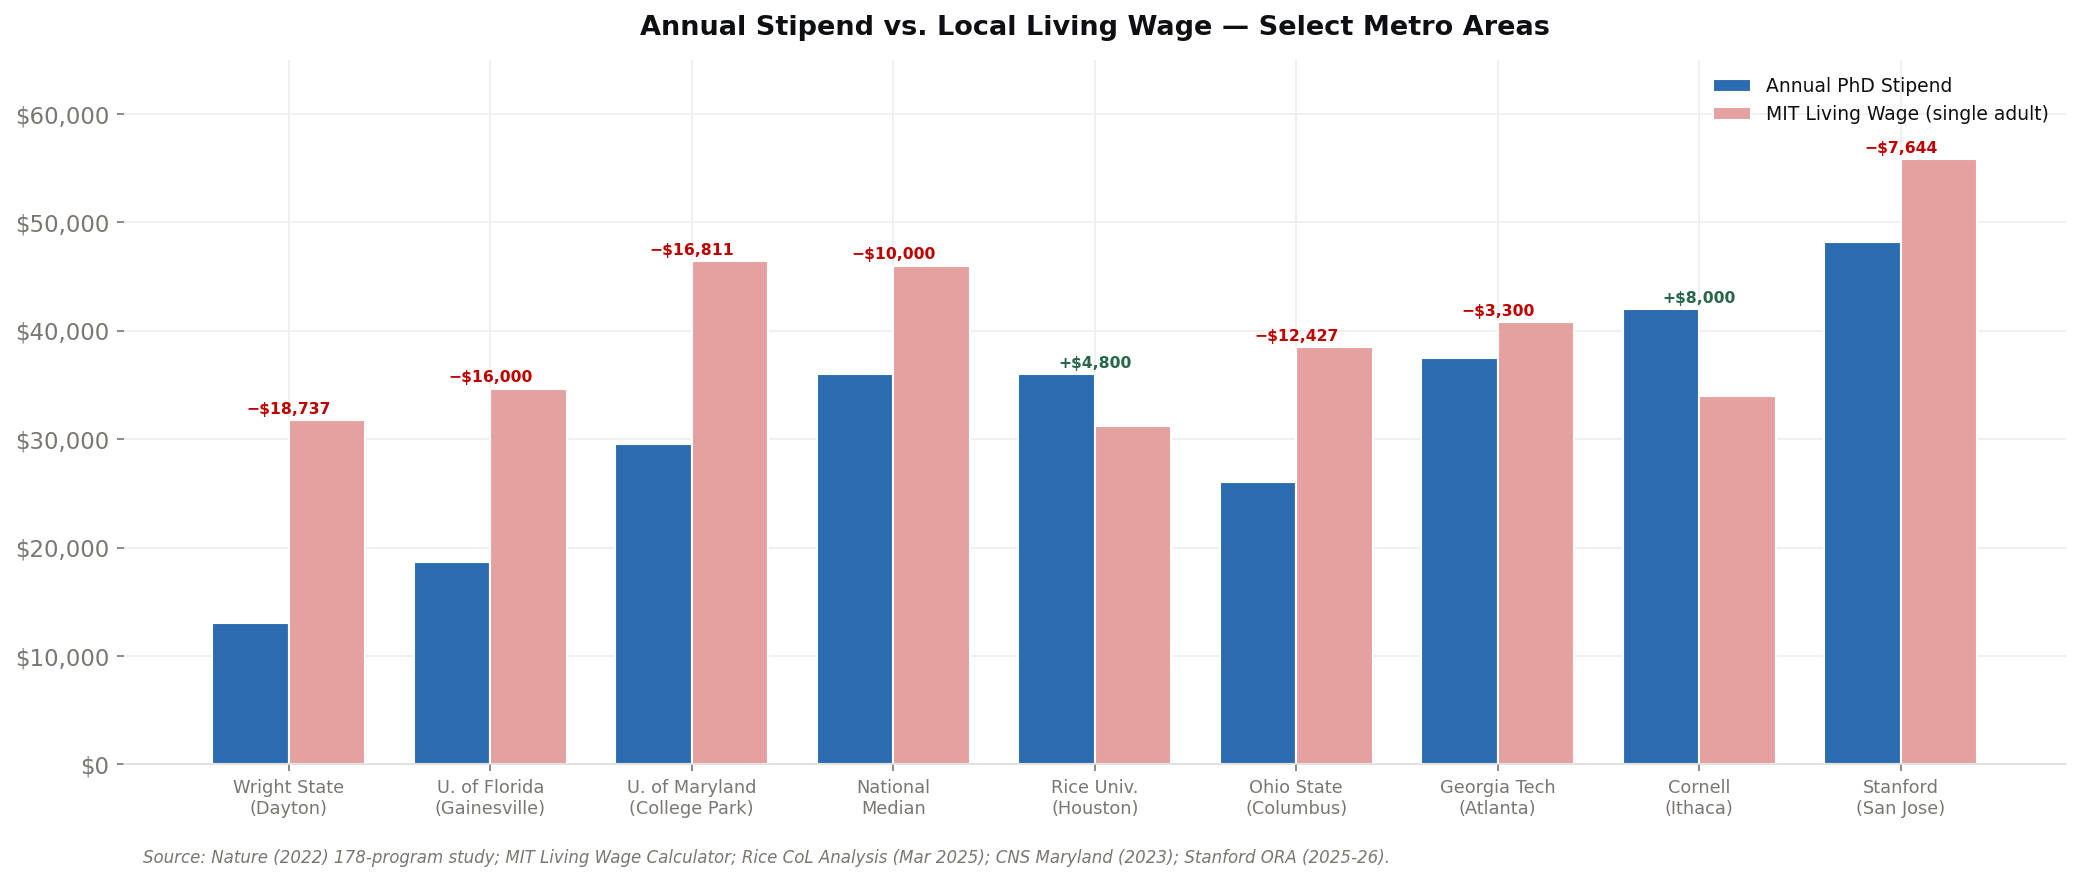
At USC, the average graduate stipend was $15,047 against average basic-needs costs of $21,515, leaving a $6,468 annual shortfall. At Stanford, one of the strongest nominal packages in the dataset at $48,216 still falls $7,644 short of Santa Clara County's estimated living wage.
"The average baseline stipend increase across departments is 11% for fiscal year 2026 - the third consecutive year of benchmark-driven floor increases."
University of Kentucky Graduate Stipend and Benefits Committee, April 2025
Benchmark Stipend Amounts
Graduate stipend floors are rising from very different starting points. The Oklahoma State University Graduate Stipend Survey remains one of the most widely used benchmarking anchors for research universities, especially across SEC and peer institutions.
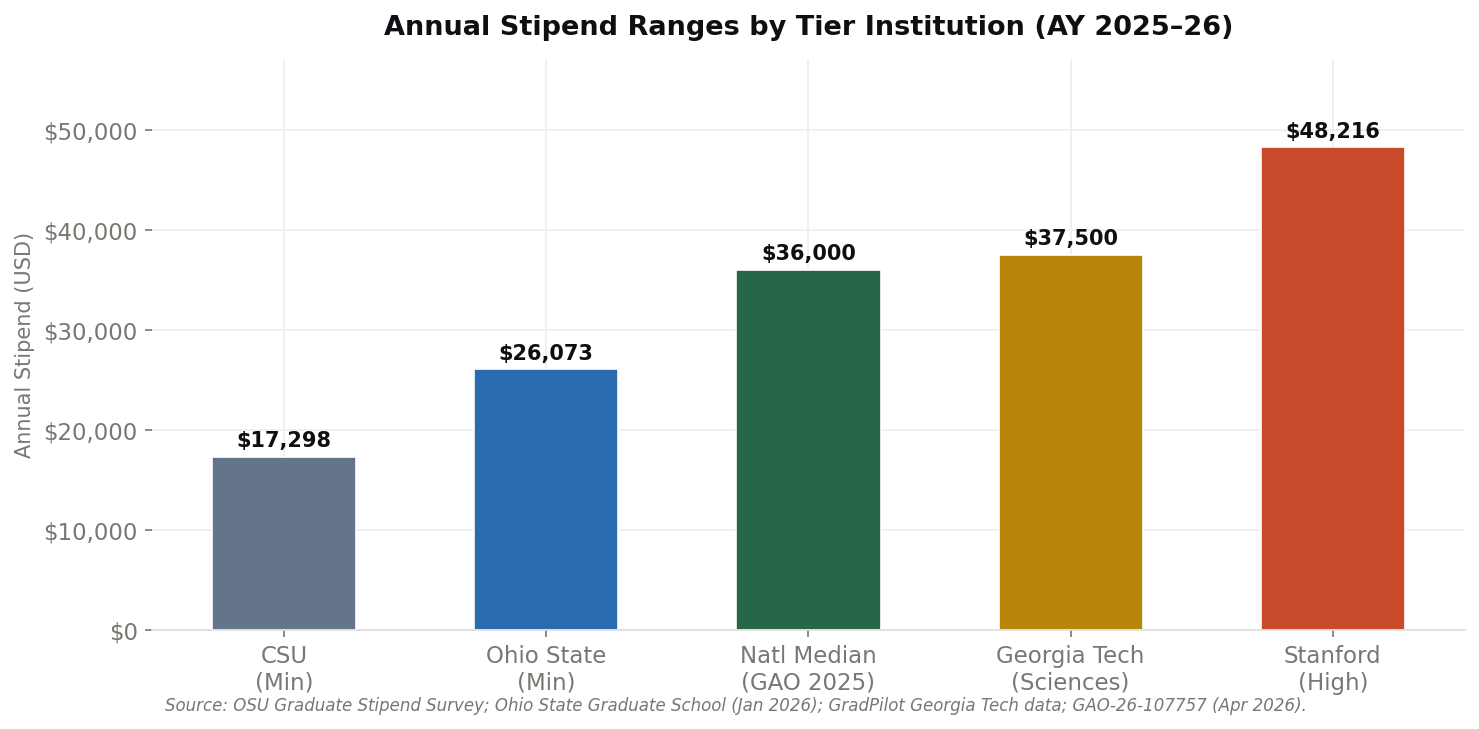
| Institution | Stipend | Basis | FTE / structure | Change or note | Source |
|---|
| Ohio State University | $26,073 (9-month) / $34,764 (12-month) | Minimum floor, graduate associate | 50% | +8% | Ohio State Graduate School, Jan 2026 |
| Cornell University | Up to $52,026 | Academic-year maximum from university-held funds | Varies | CBA-set | Cornell Graduate School, Aug 2025 |
| Colorado State University | $1,922 per month, about $17,298 for 9 months | Minimum GA rate | 50% | +1% | CSU Graduate School, 2025-26 |
| Michigan State University | Varies; $9,085 per semester SI charge | GA tuition + health structure | 50% | SI +5% | MSU HR Stipend Ranges, 2026-27 |
| Stanford University | $48,216 | NIH-aligned benchmark high | 50% | NIH NRSA-linked | Stanford ORA / NIH NOT-OD-25-105 |
| Georgia Tech | $37,500 | College of Sciences floor | GRA | Among highest in sample | GradPilot / Georgia Tech, Oct 2025 |
| Arizona State University | $26,544 minimum | Institutional minimum | 50% | Benchmark cited in 2025-26 reporting | GradPilot / ASU, Oct 2025 |
| NIH NRSA zero-level cap | $62,232 | Federal support ceiling | Full | Upper benchmark, not a typical PhD stipend | NIH NOT-OD-25-105 |
The institutional spread is wide. Elite research universities sit near the top, but higher nominal pay does not automatically imply stronger real compensation. Institutional prestige, federal grant intensity, and labor-market pressure all shape stipend floors, but affordability still depends on geography and appointment terms.
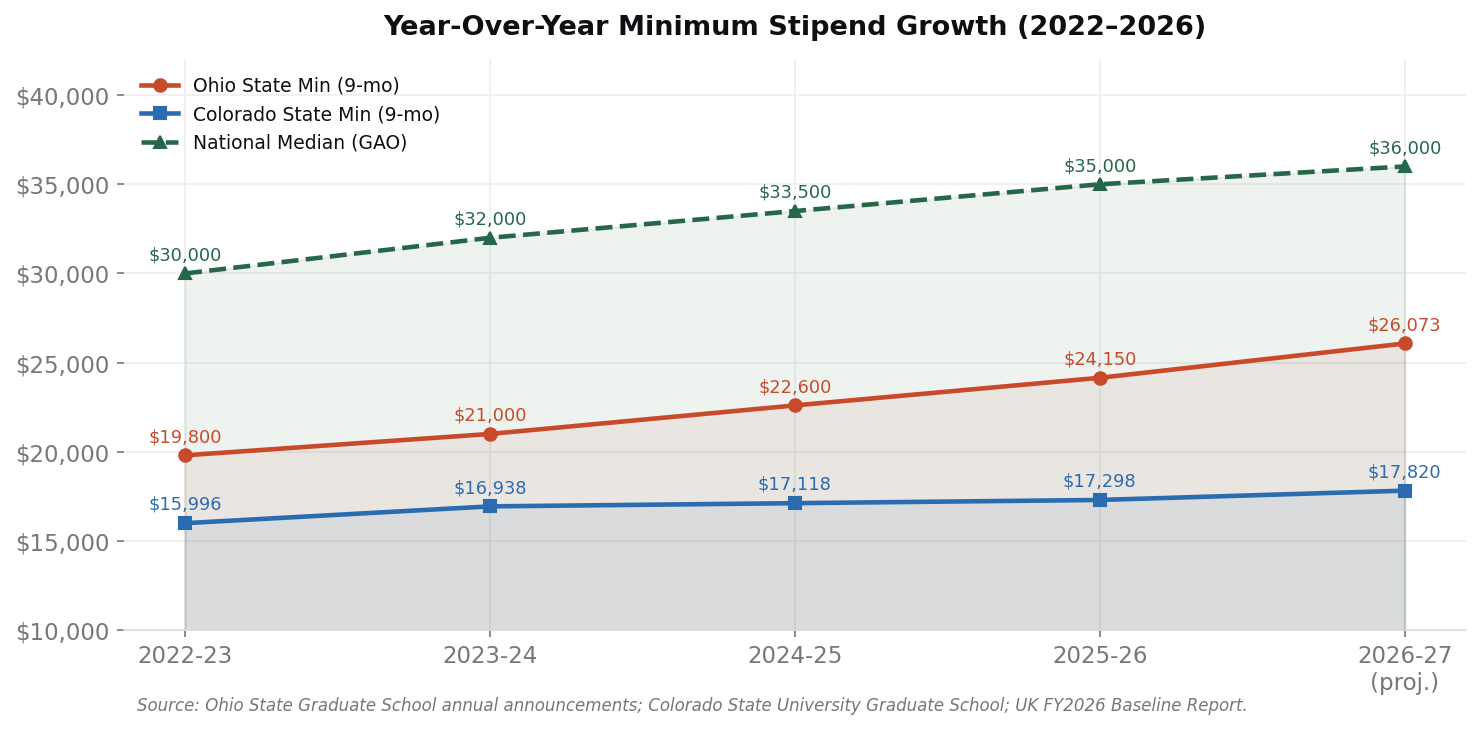
The growth trend is real. Ohio State's floor climbed from $19,800 in 2022-23 to a projected $26,073 in 2026-27, while the national median line rose from $30,000 to $36,000 over the same period. That is meaningful progress, but the adequacy problem remains because living costs and funding structure continue to absorb those increases.
Tuition Waiver Status
Tuition waivers remain one of the most under-discussed components of graduate funding. For funded PhD students at research-intensive institutions, full waivers are common. For master's students, waiver access is significantly more limited and often conditional on assistantship status, enrollment status, or field.
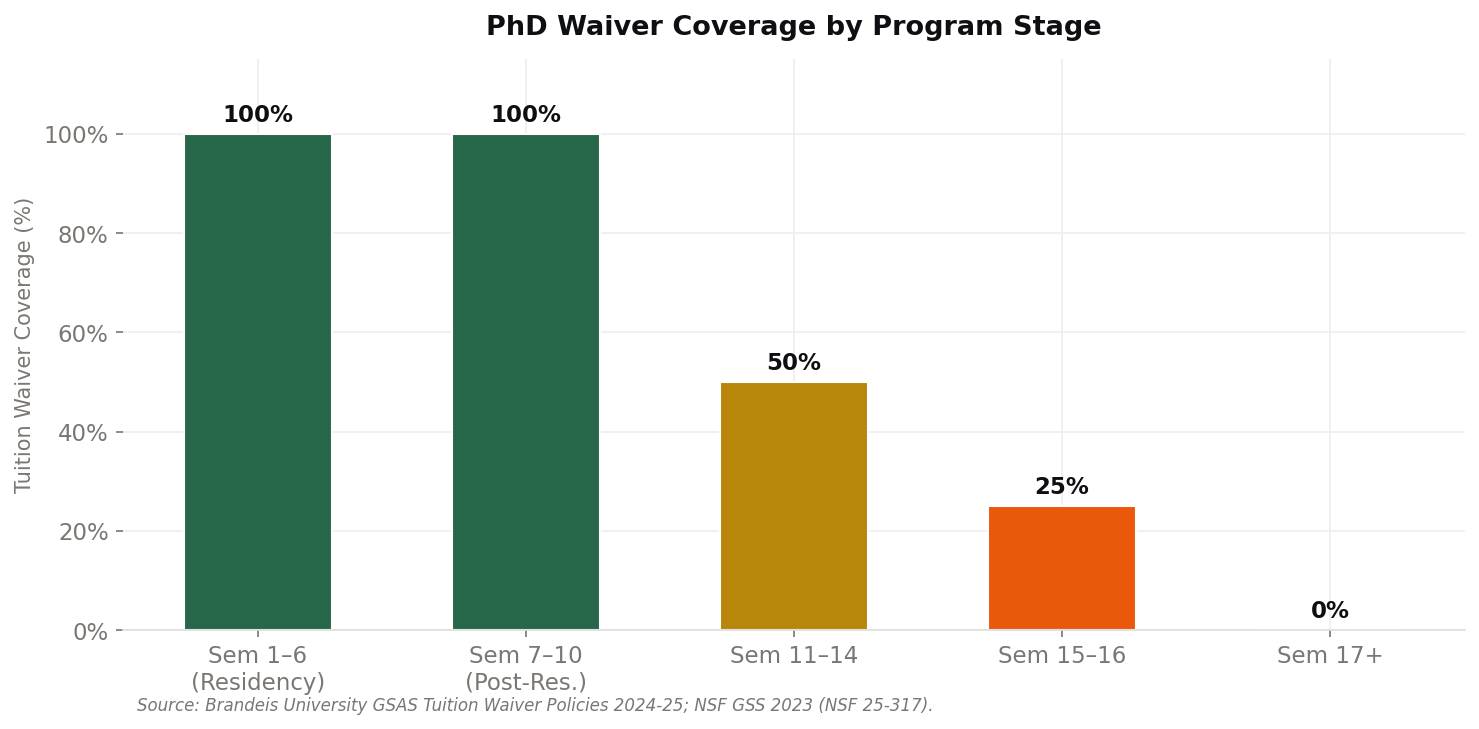
| Program stage | Semesters | Waiver coverage | Effective cost |
|---|
| Residency cohort | 1-6 | 100% | $0 out of pocket |
| Post-residency, full | 7-10 | 100% | $0 out of pocket |
| Post-residency, partial | 11-14 | 50% | About $932 per semester out of pocket |
| Post-residency, minimal | 15-16 | 25% | About $1,398 per semester out of pocket |
| Beyond standard timeline | 17+ | 0% | About $1,864 per semester out of pocket |
This pattern matters because many doctoral students assume a full waiver is static across the degree. In practice, some institutions protect early years and reduce support later, especially after students move beyond normal program timelines.
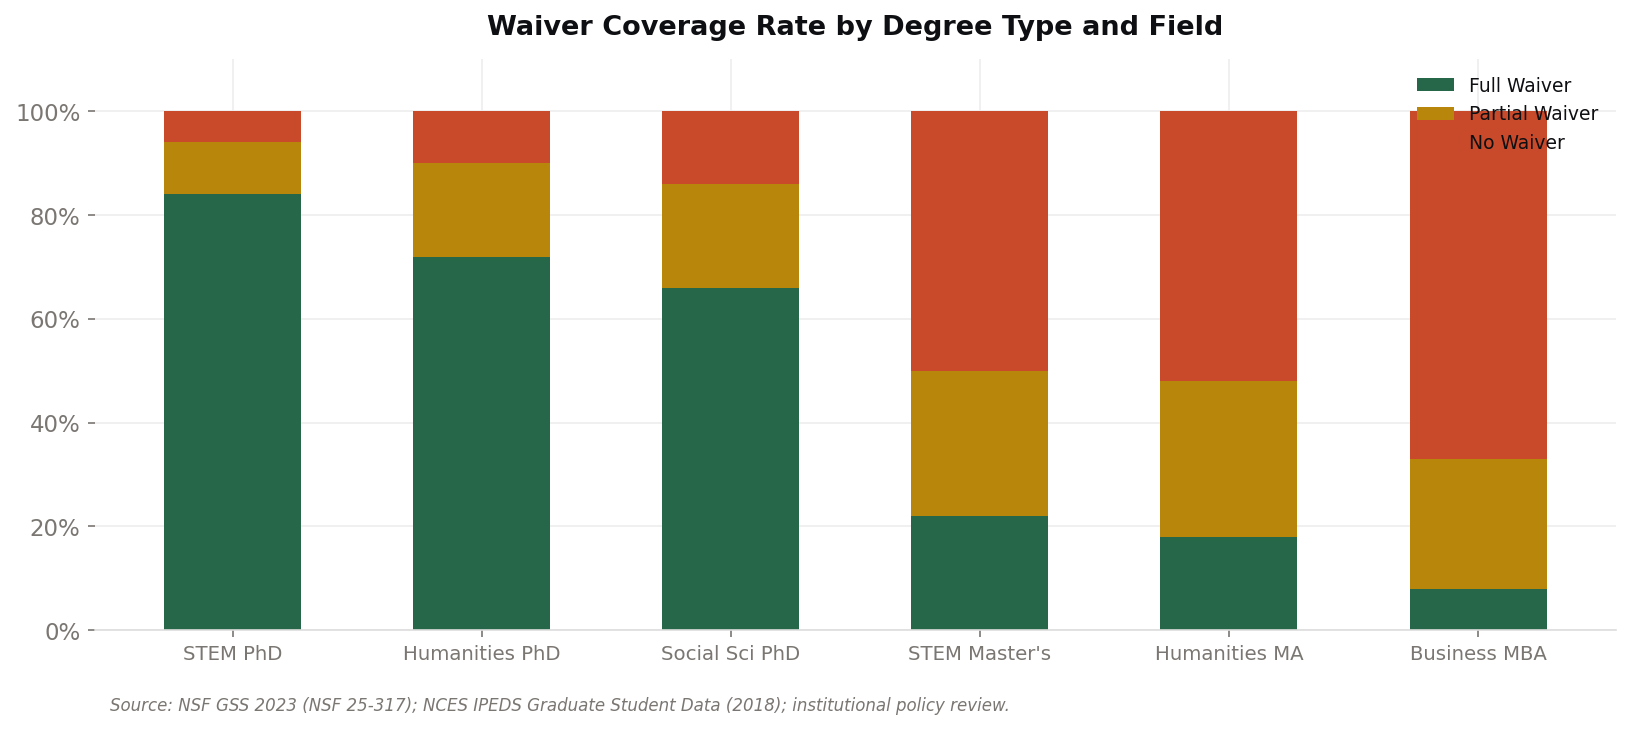
The cross-program picture is even less uniform. STEM PhD students in the benchmark data are much more likely to receive full waivers than master's students. Humanities master's and MBA cohorts show much lower full-waiver rates and much higher no-waiver rates.
Two structural caveats matter here:
- At Michigan State, engineering students face higher SI charges than non-engineering students, showing that field-specific differentials can persist even within the same university.
- Out-of-state tuition waivers are often tied to full-time degree status plus assistantship eligibility; dropped courses, provisional enrollment, or part-time status can narrow or eliminate coverage.
Assistantship Type and Appointment Structure
Graduate funding is not just about amount. It is also about how that amount is earned and what obligations come with it.
| Assistantship type | Estimated share | Primary fields | Typical funding source |
|---|
| Research assistantships (RA/GRA) | About 54% | STEM-dominant | PI grant budgets, including NIH, NSF, DoD, and DoE |
| Teaching assistantships (TA/GTA) | About 30% | All fields | University instructional budgets |
| Fellowships / stipend-only support | About 12% | Cross-field, competitive | NSF GRFP, NIH NRSA, DoD NDSEG, institutional awards |
| Graduate associates, non-academic | About 4% | Cross-disciplinary | Administrative, library, outreach, and support units |
Research assistantships dominate funded doctoral training in science and engineering because grant-funded labs absorb a large share of student labor. Teaching assistantships remain more central in humanities and social sciences, which shifts both workload and time-to-research.
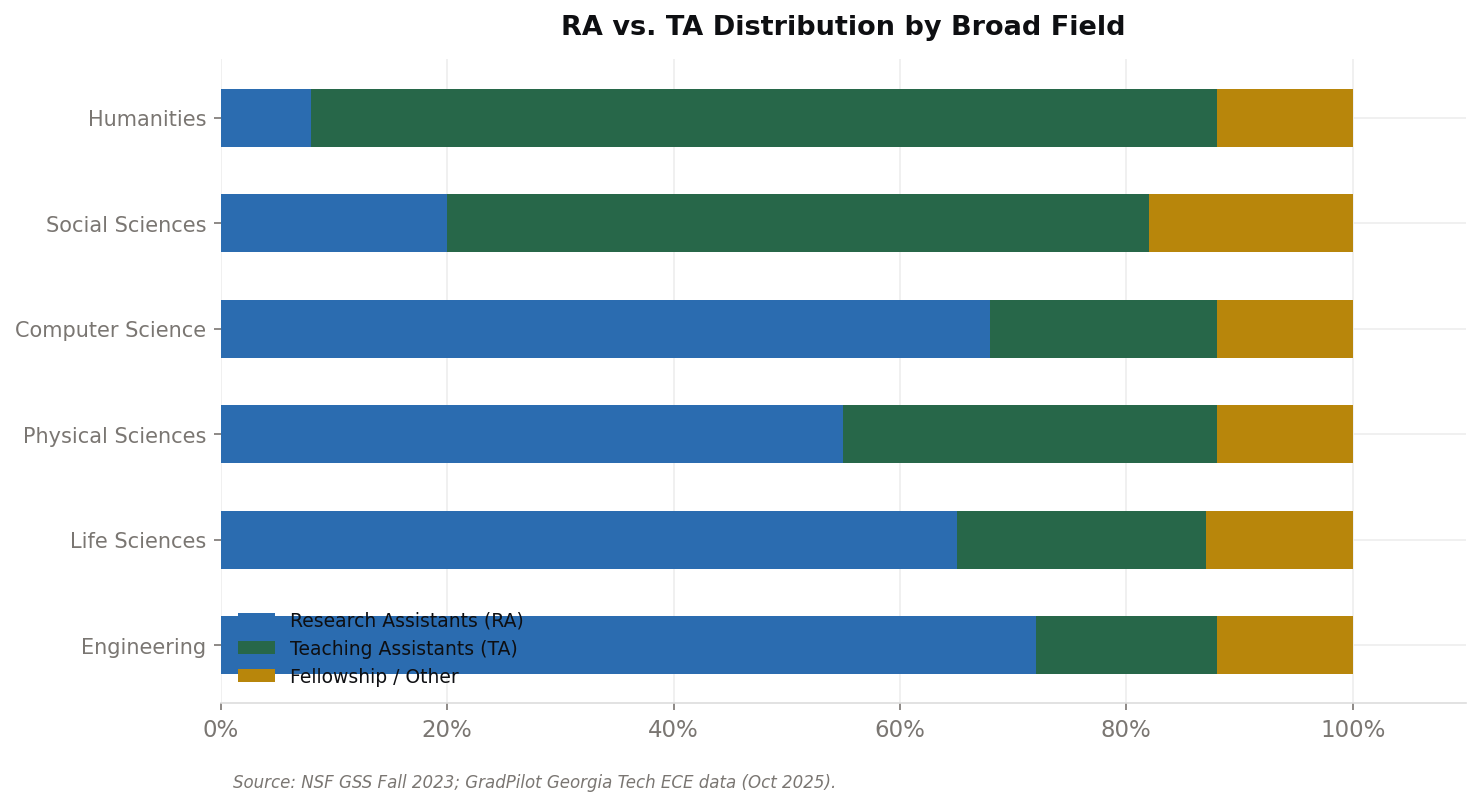
The field split is stark. Engineering, life sciences, physical sciences, and computer science skew heavily toward research assistantships, while humanities and many social sciences lean much more heavily on teaching.
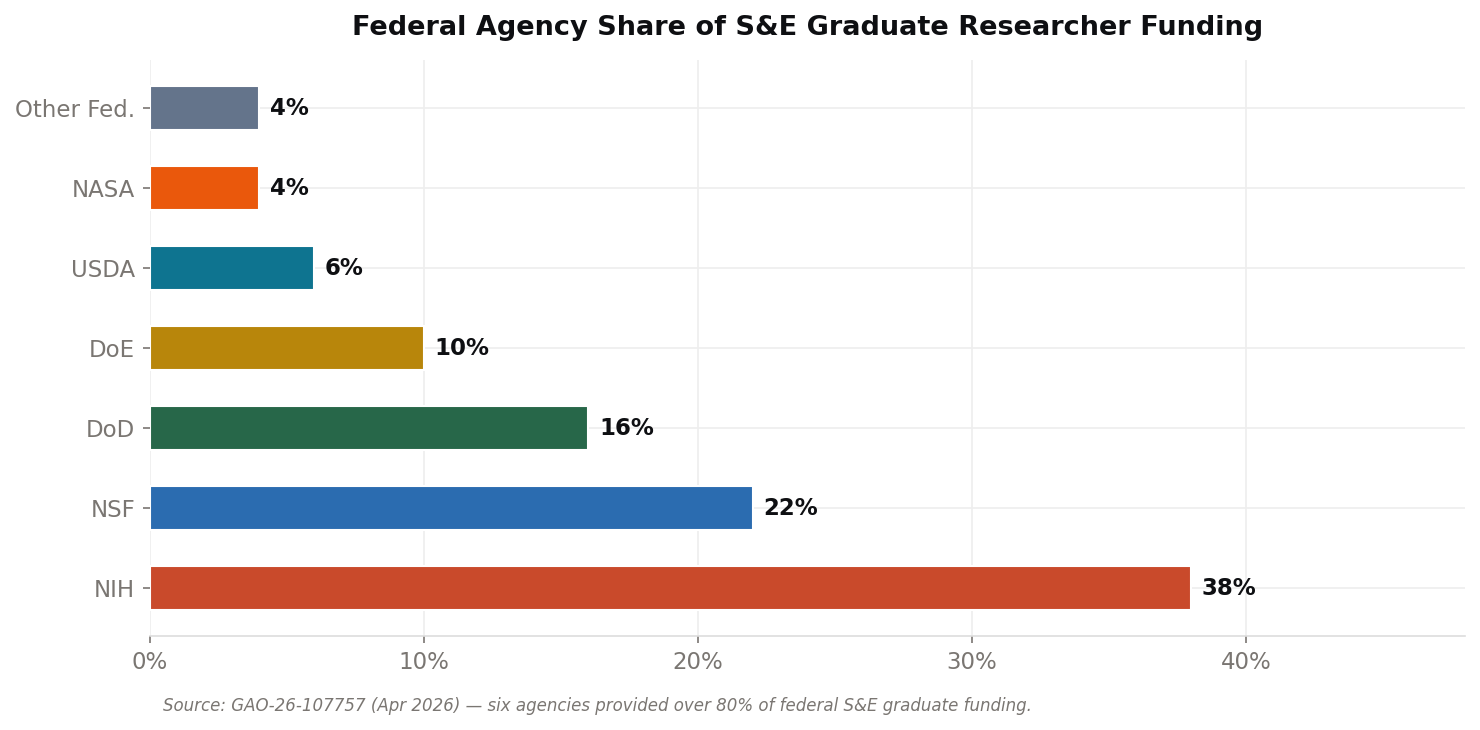
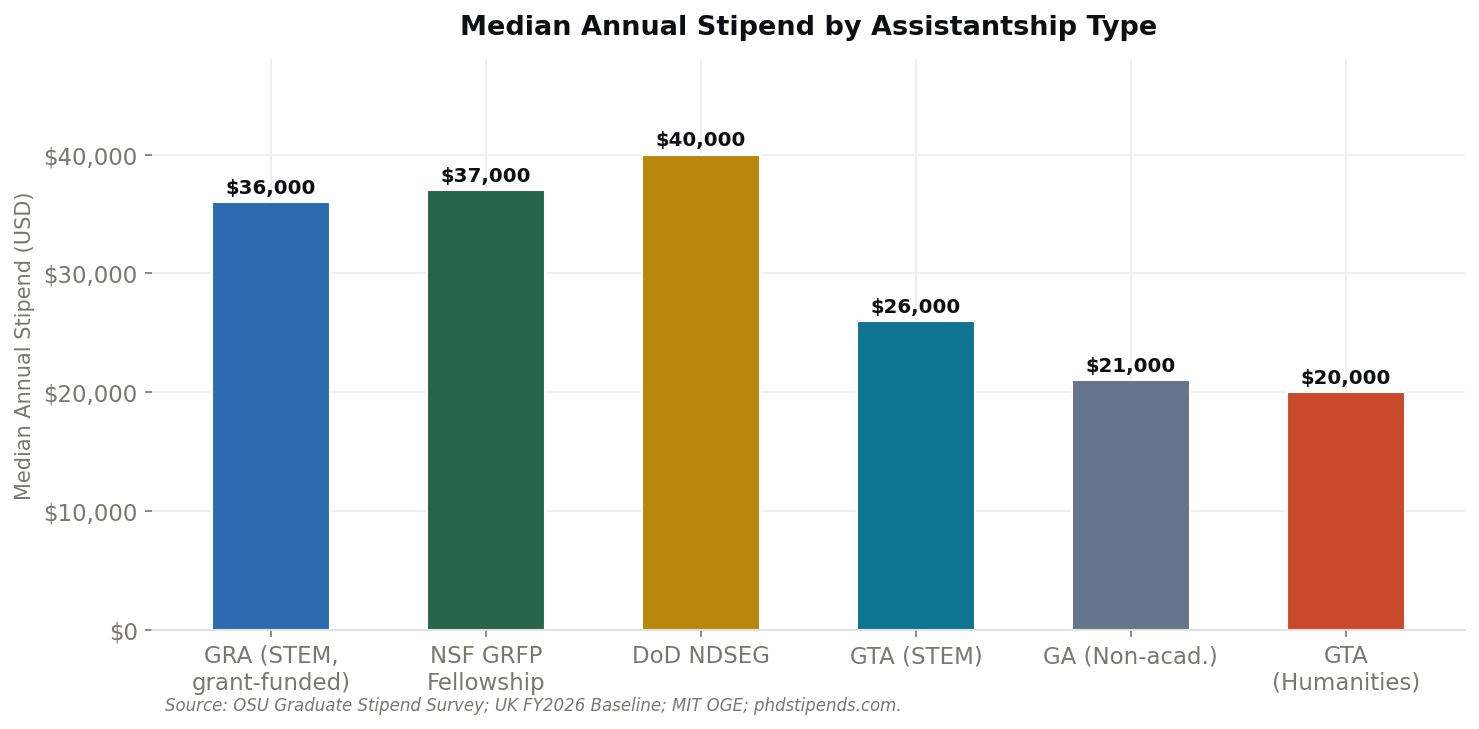
The type of funding also changes pay. In the benchmark dataset, DoD NDSEG-level fellowship support sits near $40,000, NSF GRFP around $37,000, and STEM GRAs around $36,000, while humanities GTAs sit much lower around $20,000.
At Georgia Tech, approximately 80% of doctoral students receive GRA or GTA assistantships, while only about 21% of master's students in ECE access GRA funding.
That gap matters for international master's students in particular, because assistantship access often determines both tuition relief and whether the stipend is financially meaningful.
9-Month vs. 12-Month Funding
The distinction between 9-month and 12-month funding is one of the most important and most commonly overlooked parts of graduate compensation.
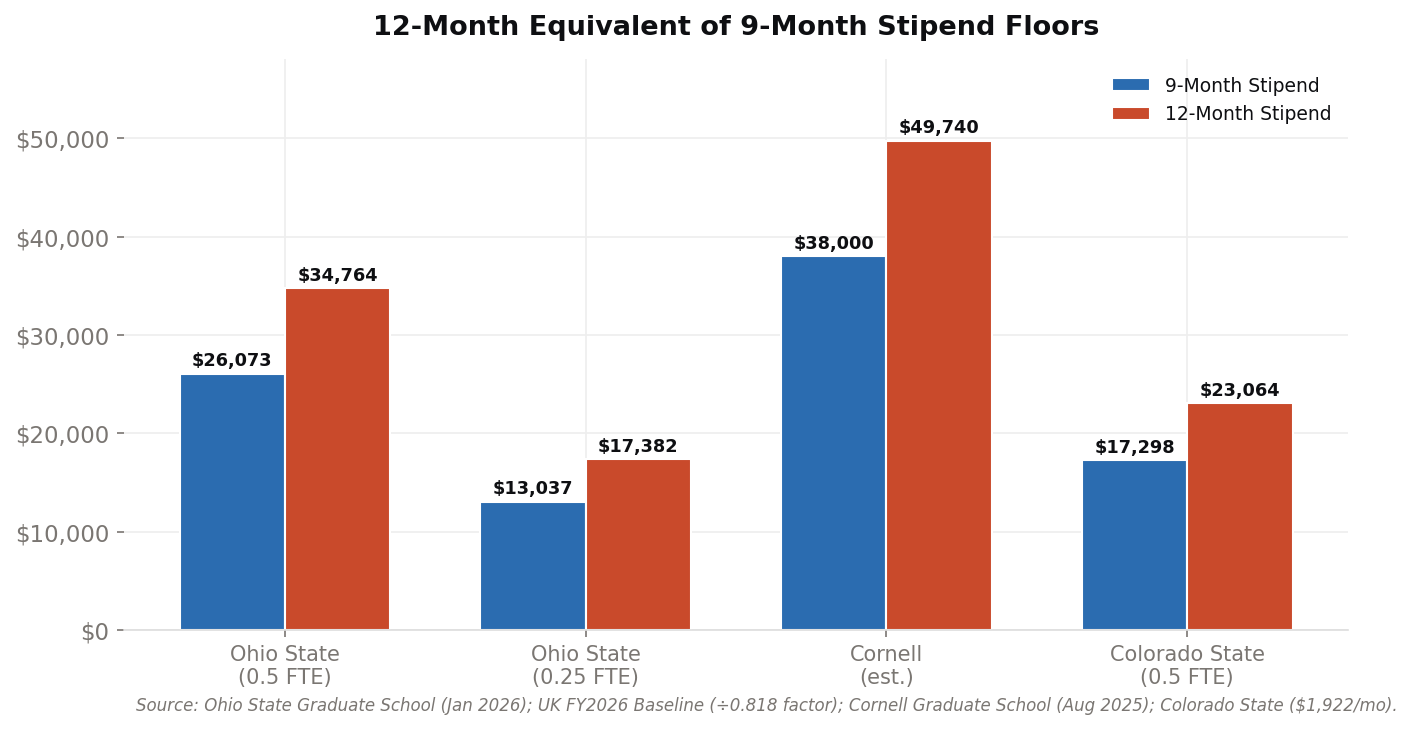
| Institution / appointment | 9-month stipend | 12-month equivalent | FTE | Source |
|---|
| Ohio State, 0.5 FTE | $26,073 | $34,764 | 50% | Ohio State Graduate School, Jan 2026 |
| Ohio State, 0.25 FTE | $13,037 | $17,382 | 25% | Ohio State Graduate School, Jan 2026 |
| Cornell, estimated average | $38,000 | $49,740 | 50% | Cornell Graduate School, Aug 2025 |
| Colorado State, 0.5 FTE | $17,298 | $23,064 | 50% | CSU Graduate School, 2025-26 |
An academic-year stipend can look competitive until it is converted into a full-year equivalent. Ohio State's 9-month floor rises by roughly one-third when annualized, which changes how students should compare it against programs with explicit summer support.
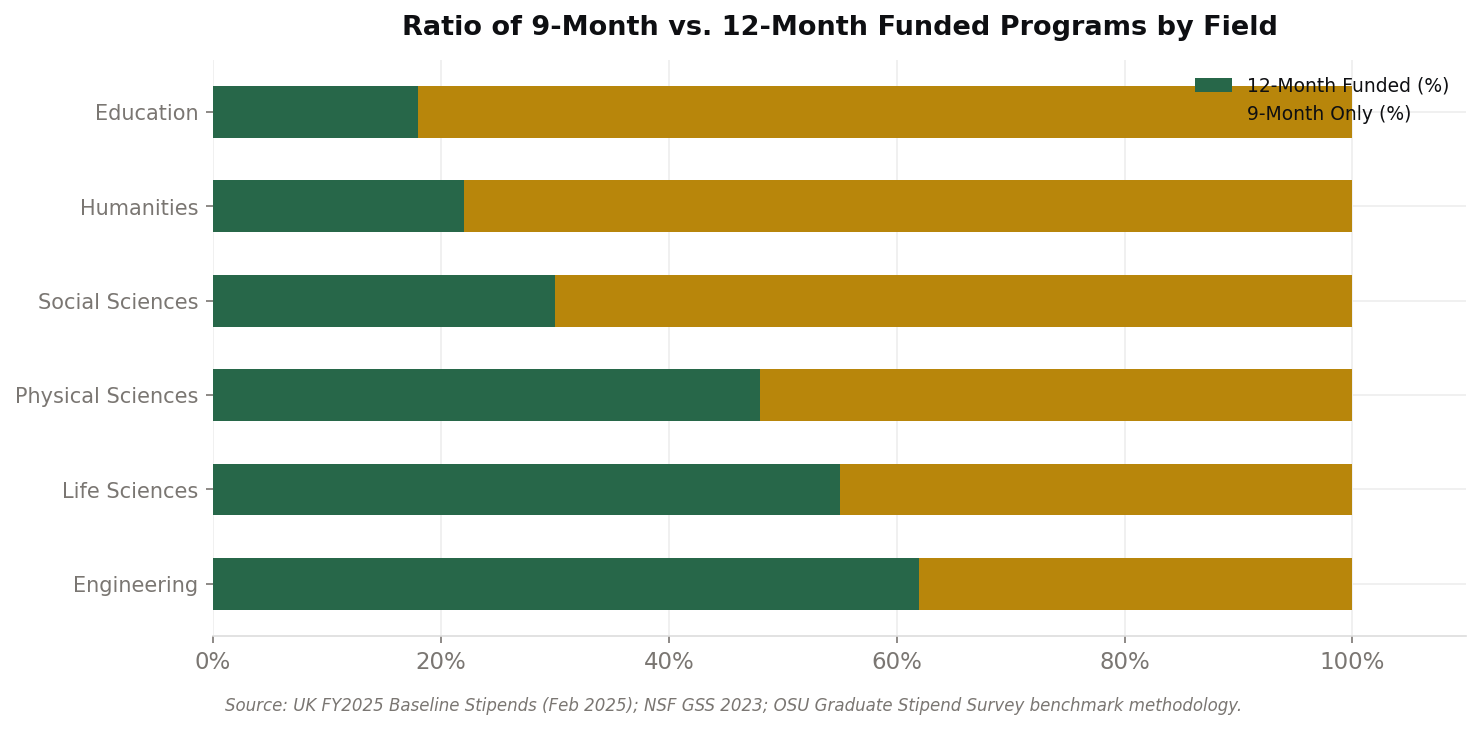
The Kentucky baseline methodology makes this explicit by dividing 9- or 10-month appointments by 0.818 to estimate a 12-month equivalent. That methodology matters because duration, not just nominal amount, drives real budget stability.
Funding by Field or Department
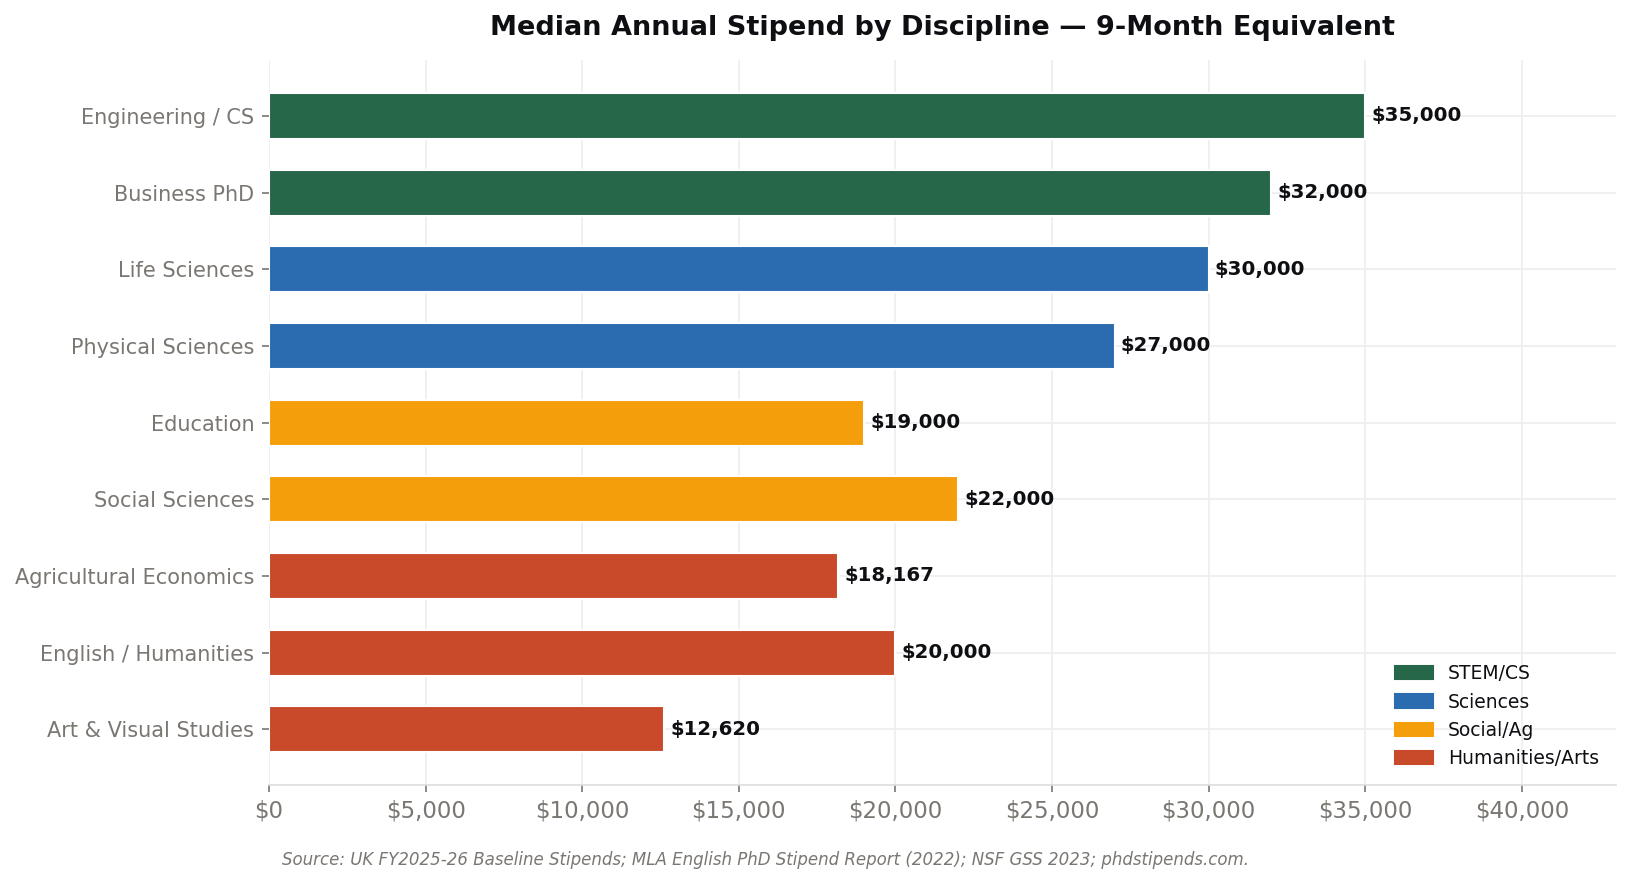
Field is one of the strongest predictors of stipend level and overall adequacy. Grant-rich STEM disciplines usually outperform humanities and many social sciences on both pay and waiver coverage.
| Field / discipline | Typical range | Typical waiver | Primary appointment | Living-wage adequacy |
|---|
| Computer science / engineering | $28,000-$45,000 | Full, often above 90% | GRA, PI-funded | Partial in high-cost metros |
| Biomedical / life sciences | $24,000-$38,000 | Full, often above 85% | GRA, NIH-linked | Often below in expensive metros |
| Physical sciences / chemistry | $22,000-$36,000 | Full, often above 80% | GRA / GTA mix | Below in most expensive regions |
| Agricultural economics | About $18,167 | Full, conditional | GRA / GTA | Below living wage |
| Social sciences | $16,000-$28,000 | Partial to full | GTA-dominant | Below in most regions |
| English / humanities | $14,000-$26,000 | Full if funded | GTA-dominant | Severely below in many cases |
| Art and visual studies | About $12,620 | Partial | GTA / instructor | Far below living wage |
| Business PhD programs | $25,000-$40,000 | Often full at top programs | RA / fellowship | Moderate gap |
Field-level differences are not marginal. They shape both the probability of full funding and the probability that funding actually clears local cost thresholds. Humanities and arts students face the weakest position on both counts in this dataset.
Geography and Cost-of-Living Adequacy
Geography is the second most important determinant of funding adequacy after field. The same nominal stipend can support a student adequately in one city and leave them deeply below subsistence in another.
| Institution / metro | Annual stipend | Living wage benchmark | Gap / surplus |
|---|
| Wright State, Dayton | $13,000 | $31,737 | -$18,737 |
| University of Florida, Gainesville | $18,650 | $34,650 | -$16,000 |
| University of Maryland, College Park | $29,592 | $46,403 | -$16,811 |
| USC, average | $15,047 | $21,515 basic-needs estimate | -$6,468 |
| National median | $36,000 | About $46,000 | -$10,000 |
| Rice, Houston | $36,000 | $31,200 | +$4,800 |
| Ohio State, Columbus | $26,073 | $38,500 | -$12,427 |
| Georgia Tech, Atlanta | $37,500 | $40,800 | -$3,300 |
| Cornell, Ithaca | $42,000 | $34,000 | +$8,000 |
| Stanford, San Jose | $48,216 | $55,860 | -$7,644 |
The affordability point is straightforward: higher nominal stipends in expensive metros often still fail to close the local cost gap. Conversely, moderately lower stipends in lower-cost regions can generate real surpluses.
| Institution | Annual stipend | Living wage | LW ratio | Status |
|---|
| Wright State | $13,000 | $31,737 | 0.41x | Far below |
| University of Florida | $18,650 | $34,650 | 0.54x | Below |
| University of Maryland | $29,592 | $46,403 | 0.64x | Below |
| USC, average | $15,047 | $21,515 | 0.70x | Below |
| National median | $36,000 | About $46,000 | 0.78x | Below |
| Ohio State | $26,073 | $38,500 | 0.68x | Below |
| Georgia Tech | $37,500 | $40,800 | 0.92x | Near parity |
| Stanford | $48,216 | $55,860 | 0.86x | Below |
| Rice, Houston | $36,000 | $31,200 | 1.15x | At or above living wage |
| Cornell, Ithaca | $42,000 | $34,000 | 1.24x | At or above living wage |
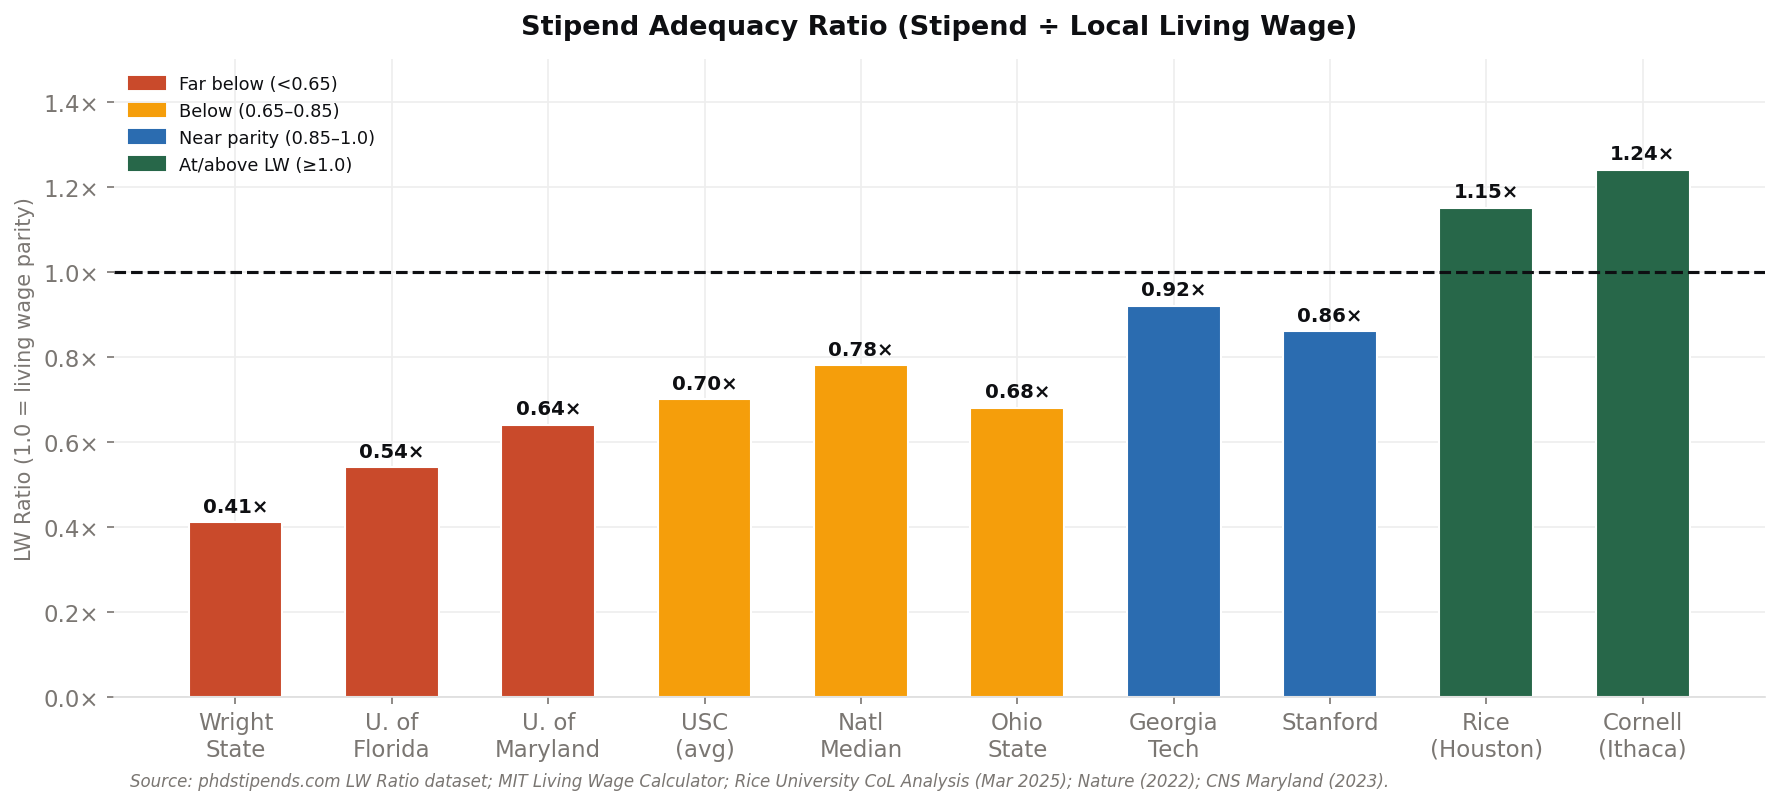
The Living Wage Ratio is one of the most useful ways to normalize offers across cities. A ratio of 1.0 means the stipend exactly matches the local living wage. In this benchmark set, most institutions remain below that threshold.
Nature's 2022 analysis found that only 2 out of 178 doctoral institutions guaranteed stipends above local living wage, and at 6% of surveyed schools students earned less than half their county's living wage. That remains one of the clearest benchmarks for how severe the adequacy problem is nationally.
Recommended comparison tools:
- Living Wage Ratio normalization using gross stipend divided by local living wage
- MIT Living Wage Calculator for county-level estimates
- C2ER-style cross-city purchasing-power comparisons where available
Funding Sources and Faculty-Level Signals
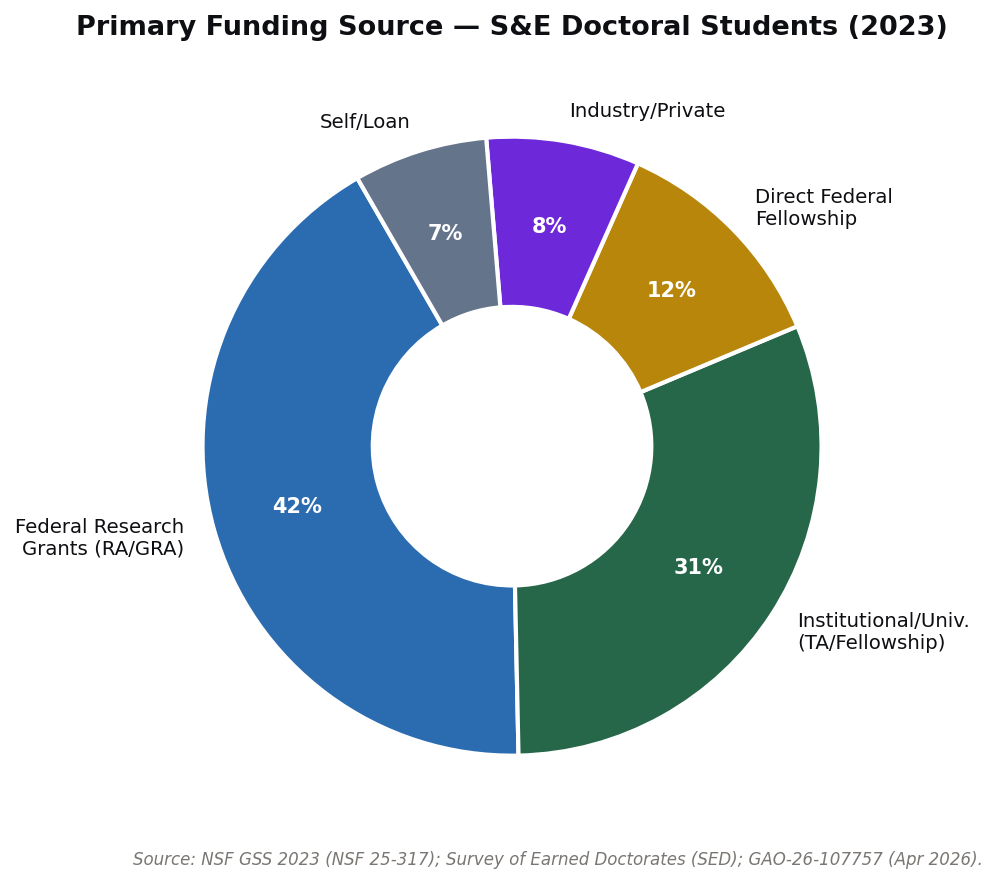
Funding mechanism affects more than pay. It shapes tuition coverage, service obligations, research autonomy, and sometimes intellectual property terms.
| Funding source | Estimated share | Source base |
|---|
| Federal research grants, RA / GRA | About 42% | NSF GSS 2023; GAO-26-107757 |
| Institutional / university support | About 31% | NSF GSS 2023; Survey of Earned Doctorates |
| Direct federal fellowships | About 12% | NSF GRFP, NIH NRSA, DoD NDSEG, SED |
| Industry / private sponsorship | About 8% | GAO-26-107757; institutional reporting |
| Self-funded / loans | About 7% | USC GSA; SED funding-source reporting |
Federal research support remains the backbone of STEM doctoral funding, with NIH and NSF carrying the largest shares. That matters because PI-funded research assistantships are only as stable as the underlying grant environment. If an offer depends heavily on a single grant or a single lab, applicants should evaluate that concentration risk directly.
| Source / mechanism | Typical stipend | Tuition treatment | Service obligation |
|---|
| NIH research grant, R01-linked | Up to $62,232 ceiling benchmark | Usually full | Research labor |
| NSF research grant | $25,000-$40,000 | Often full | Research |
| NSF GRFP fellowship | $37,000 | $16,000 cost-of-education allowance | None |
| NIH NRSA F31 | $28,224-$37,000 | Partial | None |
| DoD NDSEG / SMART | $40,000+ | Full tuition | None, though SMART includes service commitments |
| Institutional fellowship | $20,000-$35,000 | Often full for early years | None or limited TA load |
| Departmental TA | $16,000-$28,000 | Often full if enrolled | Teaching, often about 20 hours per week |
| Industry-sponsored RA | $28,000-$50,000 | Varies | Research, often with IP terms |
For applicants trying to evaluate PI-dependent support, this is the same underlying problem addressed in our guide to checking whether a potential PhD advisor has stable funding.
Practical Implications for Students Comparing Offers
The practical lesson from the benchmark report is that no single number is enough. A strong package usually combines:
- Competitive pay for the field
- Clarity on whether funding is 9 months or 12 months
- Full or near-full tuition remission
- Sustainable workload expectations
- Clear renewal conditions
- A realistic path to staying above local living-cost thresholds
The most important questions to ask before accepting an offer are simple:
- Is summer funding guaranteed or merely possible?
- Does tuition remission change after residency or candidacy?
- Is the package tied to one lab, one PI, or a broader departmental guarantee?
- How much remains out of pocket after fees, insurance, and local rent?
- What happens if the expected assistantship disappears or the project changes?
"Fully funded" is often treated as a binary category. This report shows why that framing is too blunt. The better question is whether the package is financially durable across the whole degree.
This is also why stipend comparison should not be separated from:
FAQ
What is a good PhD stipend in 2026?
A good PhD stipend in 2026 is not defined by one national number. A stronger offer usually has a workable local living-wage ratio, 12-month funding or reliable summer support, full tuition coverage, health insurance, and clear renewal terms. A $40,000 stipend can be weak in a very expensive metro, while a lower stipend can be workable in a lower-cost city.
How do you compare PhD stipends across cities?
Convert each offer to the same annual basis, subtract mandatory fees and insurance costs, then compare the remaining amount against local rent and living-wage benchmarks. The most useful quick metric is the stipend divided by a local living-cost benchmark.
Are 9-month and 12-month PhD stipends comparable?
Not directly. A 9-month stipend should be annualized before comparison, and you should verify whether summer funding is guaranteed, optional, competitive, or unavailable.
Is a higher PhD stipend always better?
No. A higher stipend can still be weaker if it comes with high fees, no summer support, heavy teaching obligations, poor advisor fit, or an expensive local housing market. Compare net value, not just the headline amount.
Selected Data Sources and Citations
- U.S. Government Accountability Office, GAO-26-107757. STEM compensation benchmarks for graduate researchers and postdoctoral scholars, April 8, 2026.
- Oklahoma State University Graduate Stipend Survey and associated institutional benchmarking references used by peer universities including Ohio State and Kentucky.
- University of Kentucky FY 2026 Baseline Stipends, April 9, 2025.
- Ohio State minimum graduate associate and fellowship stipend increase announcement, January 23, 2026.
- Cornell Graduate School stipend rates, accessed May 2026.
- NSF Survey of Graduate Students and Postdoctorates in S&E, NSF 25-317.
- Nature, "PhD students face cash crisis with wages that don't cover living costs", May 23, 2022.
- phdstipends.com results, used for living-wage ratio comparisons.
- MIT Living Wage Calculator methodology.
- MLA English PhD stipends statistical report.
- Rice University cost-of-living analysis for PhD stipends.
- USC Graduate Student Association stipend and cost-of-living report.
- GradPilot report on TA, RA, and GA funding access for international MS students.
- Colorado State University graduate assistant stipend page.
- NIH notice NOT-OD-25-105 and related grants policy guidance on graduate support levels.
- Brandeis GSAS tuition waiver policies.
- Survey of Earned Doctorates.
- Supporting institutional and program references used in the original benchmark compilation, including Florida, Maryland, Stanford, and Georgia Tech materials cited in the source report.
Disclaimer
This report synthesizes publicly available institutional, federal, and survey data as of May 2026. Stipend amounts, waiver structures, and program policies change frequently. Readers should verify current numbers with the official graduate school, department, and funding pages of each institution before making enrollment decisions. This report is informational and should not be treated as a substitute for official financial aid counseling.
 Streamlined AI