● phd · 15 min read
What Percent of People Have a PhD? 2026 Stats
See what share of U.S. adults hold a PhD, with 2026 breakdowns by gender, race, field, state, and international comparison.
A
Amos Oppong
Last Updated
See what share of U.S. adults hold a PhD, with 2026 breakdowns by gender, race, field, state, and international comparison.
If you're considering pursuing a PhD or simply curious about doctoral education, you might wonder: exactly what percentage of people have a PhD? The answer reveals just how exclusive this achievement remains, both in the United States and globally.
Understanding these statistics provides context for the value and rarity of doctoral degrees, the demographics of PhD holders, and emerging trends in doctoral education. Whether you're a prospective graduate student, a career advisor, or simply interested in educational attainment data, this comprehensive guide breaks down the numbers.
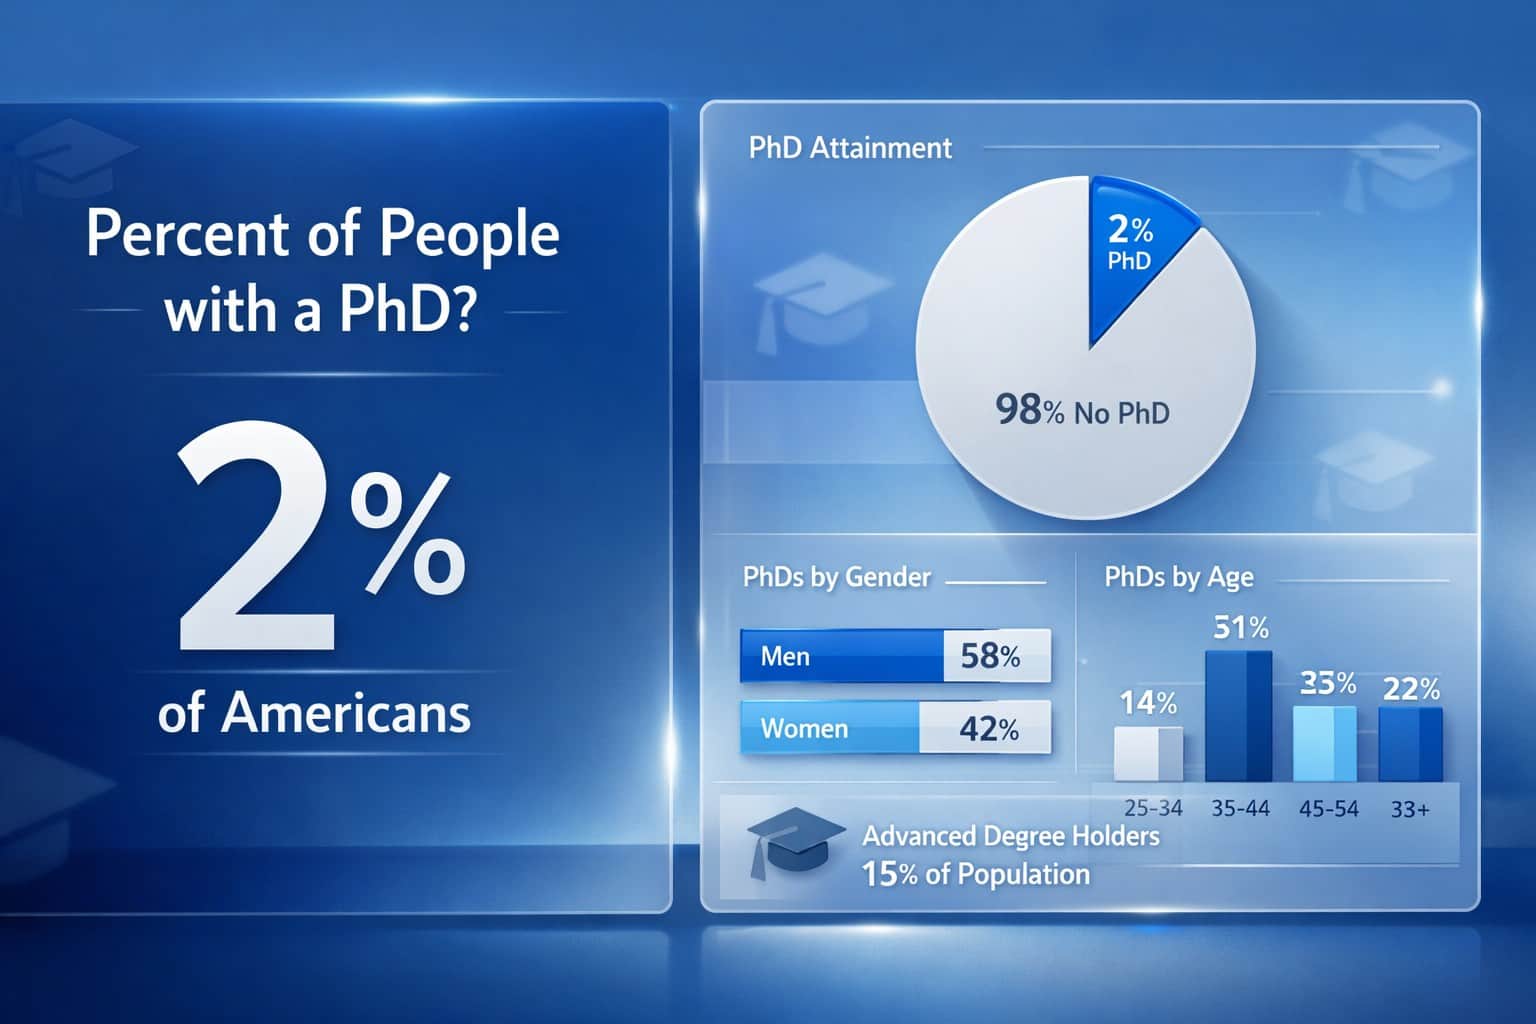
According to the U.S. Census Bureau's American Community Survey (2022 data, released 2023), approximately 2.0% of American adults aged 25 and older hold a doctoral degree. This translates to an estimated 4+ million people out of a population of over 230 million adults.
Source: U.S. Census Bureau, American Community Survey 2022 1-Year Estimates, Table S1501
To put this in perspective:
The complete picture of educational attainment in the United States shows (2022 data):
Source: U.S. Census Bureau, Educational Attainment in the United States: 2022
When we combine all terminal degrees (professional degrees and doctoral degrees), approximately 4.4% of Americans hold the highest level of educational credentials.
Put the insight to work
Search more than one million faculty profiles by topic, institution, and country. Start with this article’s topic or enter your own.
The percentage of people with a PhD varies significantly across countries, reflecting different educational systems, economic development, and cultural attitudes toward advanced education.
Estimating the global percentage of PhD holders is challenging due to varying data collection methods and definitions across countries. However, research suggests:
Note: Global estimates are approximate due to inconsistent reporting standards and varying definitions of doctoral degrees across countries.
Different nations show vastly different PhD attainment rates (approximate figures based on OECD Education at a Glance 2023 and national statistics):
High PhD Attainment:
Moderate PhD Attainment:
Lower PhD Attainment:
Note: Developing nation figures are estimates and may not reflect recent growth in doctoral education.
These differences reflect factors including:
Understanding the percentage of people with a PhD becomes more nuanced when we examine specific demographic groups. These statistics reveal important patterns in educational access and achievement.
Doctoral degree attainment varies by age cohort, reflecting both the time required to earn the degree and generational trends:
The median age at which Americans earn their PhD is approximately 31-33 years, though this varies significantly by field.
The gender composition of PhD holders has shifted dramatically over recent decades:
Current Distribution (2022 Census data):
However, recent trends show convergence:
Source: NSF Survey of Earned Doctorates 2022; U.S. Census Bureau ACS 2022
Significant disparities persist in doctoral degree attainment across racial and ethnic groups (2022 data):
Source: U.S. Census Bureau ACS 2022. Note: Asian American category includes diverse ethnic groups with varying educational attainment patterns.
These disparities reflect systemic barriers including:
Efforts to increase diversity in doctoral education remain a critical priority, with many institutions implementing targeted recruitment, funding, and support programs.
The concentration of PhD holders varies dramatically by field (based on 2022 doctoral awards):
Highest PhD Production Fields:
Smallest Fields:
Note that field popularity has shifted over time, with computer science PhDs growing rapidly while humanities PhDs have declined.
Source: NSF Survey of Earned Doctorates 2022
The percentage of Americans with PhDs has grown steadily over the past several decades, though the rate of growth has varied.
This represents a doubling over 40 years, though growth has plateaued recently.
Source: U.S. Census Bureau, Historical Educational Attainment Tables. Figures are rounded estimates from decennial census and American Community Survey data.
The United States awards approximately 55,000-58,000 research doctorates annually (over 57,000 in 2022), according to the National Science Foundation's Survey of Earned Doctorates.
Key trends include:
Source: NSF Survey of Earned Doctorates 2022
Based on current trends, modest continued growth in PhD attainment appears likely:
Note: Projections are extrapolations based on current trends and should be treated as estimates rather than forecasts.
Understanding how many people have a PhD provides valuable context in several areas:
Knowing that only 2% of Americans hold PhDs helps prospective students understand:
Policymakers use these statistics to:
PhD attainment rates correlate with:
Countries with higher PhD attainment rates generally show stronger research and development ecosystems.
PhD statistics illuminate patterns of educational mobility:
To fully understand what percent of people have a PhD, it helps to compare doctoral degrees to other graduate credentials:
A PhD remains rarer than a master's degree but comparable in prevalence to professional degrees. However, PhDs require:
The distinct nature of the PhD—focused on creating new knowledge rather than applying existing knowledge—makes it fundamentally different from other graduate degrees.
The percentage of people with PhDs varies considerably across U.S. geography (2022 ACS data):
Source: U.S. Census Bureau, American Community Survey 2022 state-level estimates
These regional differences reflect:
Let's answer the core question directly with context:
In the United States: Only 2 out of every 100 adults hold a doctoral degree. This makes PhD holders a small, elite group representing the highest level of educational achievement.
Globally: The percentage drops to approximately 0.5-1.0% (estimated), making PhDs even rarer on the world stage.
Among college graduates: Even among those who earn bachelor's degrees, only about 5% will eventually complete a PhD.
If you're considering a PhD:
If you hold a PhD:
While understanding what percentage of people have a PhD provides useful context, the decision to pursue one should extend beyond statistics. Consider:
The statistics are clear: only 2% of Americans and approximately 1% of people globally hold doctoral degrees. This rarity reflects the substantial commitment, rigorous standards, and specialized nature of PhD training.
However, these numbers also reveal opportunity. With over 57,000 PhDs awarded annually in the U.S. alone, thousands of individuals successfully complete this journey each year. The demographic trends show increasing diversity and evolving field preferences, suggesting the doctoral education landscape continues to adapt.
Whether you're evaluating your own educational path, advising students, or simply satisfying curiosity, understanding that PhDs remain rare but attainable provides important context. The 2% figure represents not just exclusivity, but the collective expertise of millions of individuals who have pushed the boundaries of human knowledge.
If you're considering joining their ranks, base your decision on passion for research, clear career goals, and realistic understanding of the commitment involved. The statistics show that a PhD remains one of the most prestigious educational achievements—and one of the most transformative personal journeys you can undertake.
While exact global figures are difficult to determine due to inconsistent international reporting, rough estimates suggest approximately 40+ million people worldwide hold doctoral degrees, representing an estimated 0.5-1.0% of the global adult population. This estimate should be treated as approximate given data limitations.
The District of Columbia has the highest PhD attainment rate, at roughly 8.5% based on recent U.S. estimates. Its concentration of federal agencies, policy institutions, and research organizations drives that unusually high share. Among U.S. states, Massachusetts is typically the top performer at around 3.8%, reflecting strong university density and research employment.
Yes, but growth is gradual rather than explosive. U.S. PhD attainment has risen from about 1.0% in 1980 to roughly 2.0% in recent data, and annual doctorate production now exceeds 57,000. Even with that increase, doctoral degrees remain rare in the general population, so prevalence is rising slowly from a low baseline.
In the United States, about 13.7% of adults aged 25+ hold a master's degree, based on recent Census estimates. That makes master's attainment far more common than doctoral attainment, which is closer to 2.0%. The comparison is useful when evaluating education pathways, because master's degrees are broader in access, duration, and career application.
PhD production varies sharply by discipline. Engineering contributes the largest share of doctorates (around 20%), followed by life sciences (about 16%) and physical sciences (about 10%). Humanities, education, and business usually represent smaller shares. Field differences reflect labor demand, research funding levels, program capacity, and typical career pathways after graduation.
Historically, men earned most PhDs, but as of 2022, women earn 47% of all research doctorates in the U.S. (52% among U.S. citizens and permanent residents). Among current PhD holders (all ages), men still slightly outnumber women (2.2% vs. 1.8%) due to historical trends.
In the United States, the median age at PhD completion is usually around 31-33 years. That average shifts by field, prior work experience, and entry pathway. STEM candidates often finish younger because of tighter lab structures, while humanities and some social science programs can run longer due to archival work, teaching demands, and dissertation scope.
Lifetime earnings for doctoral degree holders vary significantly by field, but some estimates suggest cumulative earnings of $3.4+ million on average—roughly 25-30% more than bachelor's degree holders in comparable fields. However, ROI varies dramatically by discipline (STEM vs. humanities), and the 5-7 year opportunity cost plus potential student debt must be considered.
Note: Earnings estimates are based on median lifetime earnings projections and vary widely by field, industry, and career path. Sources include Georgetown University Center on Education and the Workforce and U.S. Census Bureau earnings data.
Ready to pursue your PhD? Explore our comprehensive guide to PhD programs and find the right advisor for your research journey on StreamlinedAI.